Assgimment by Wilfrido J. Paredes Garcia ([email protected] at Coursera)

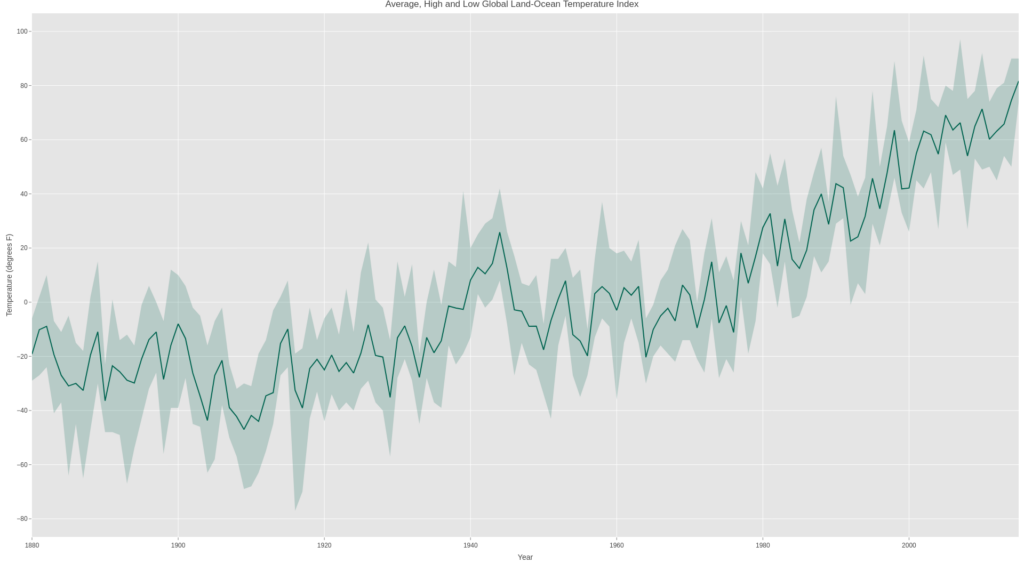
The file provided had two sets of data about global temperature: monthly global temperature averages and annual temperature averages by zone. The first set of data was used to construct the figure, so in the figure the average global temperature can be observed, the bands that accompany it were using the average temperature corresponding to the coldest month and the warmest month. Something that is important to highlight is that the graph shows clear evidence of the problem of global warming today.